
Power File Databasing
Spent a wee-bit of time figuring out how to decode the binary bits and bytes of the SRM power meter file format.
Great insight and c++ code over at goldencheetah.org.
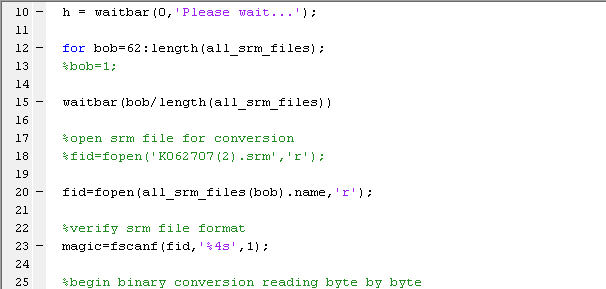
Here's the first little bit of code in the script I wrote for batch importing SRM files and creating a matlab database for subsequent analysis:
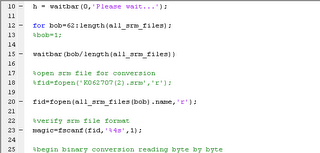
With this piece of code, it's pretty easy to simplify big jobs like putting together plots like the following for 300+ power meter files (this plot was kind of inspired by Dr. Allen Lim of the Saris Group in this Q&A tidbit - http://www.saris.com/t-PowerTourQA.aspx#NormalizedPower ):
For those interested in further reading about this plot that orginally appeared in an old article on the main btr site you can check out:
http://www.biketechreview.com/power/strain.htm
not much has changed globally since 2004/2005, eh?
Anyway, this database creation tool I've created is pretty cool - it sequentially opens up each individual file in the native SRM format and processes the data any which way you like - well, at least any which way you can code something up! pretty cool, huh!?
oh, man, I'm a total dork... ;-)
Great insight and c++ code over at goldencheetah.org.
Here's the first little bit of code in the script I wrote for batch importing SRM files and creating a matlab database for subsequent analysis:
With this piece of code, it's pretty easy to simplify big jobs like putting together plots like the following for 300+ power meter files (this plot was kind of inspired by Dr. Allen Lim of the Saris Group in this Q&A tidbit - http://www.saris.com/t-PowerTourQA.aspx#NormalizedPower ):
For those interested in further reading about this plot that orginally appeared in an old article on the main btr site you can check out:
http://www.biketechreview.com/power/strain.htm
not much has changed globally since 2004/2005, eh?
Anyway, this database creation tool I've created is pretty cool - it sequentially opens up each individual file in the native SRM format and processes the data any which way you like - well, at least any which way you can code something up! pretty cool, huh!?
oh, man, I'm a total dork... ;-)
posted by kraig at
6:02 PM
![]()
![]()


8 Comments:
Kraig,
What's the R^2 value if you remove the rides with a "score" (your vertical axis, whatever it is) of less than, say , 100?
Just curious.
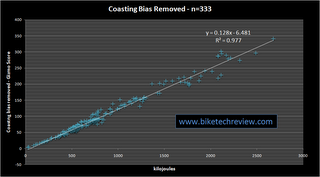
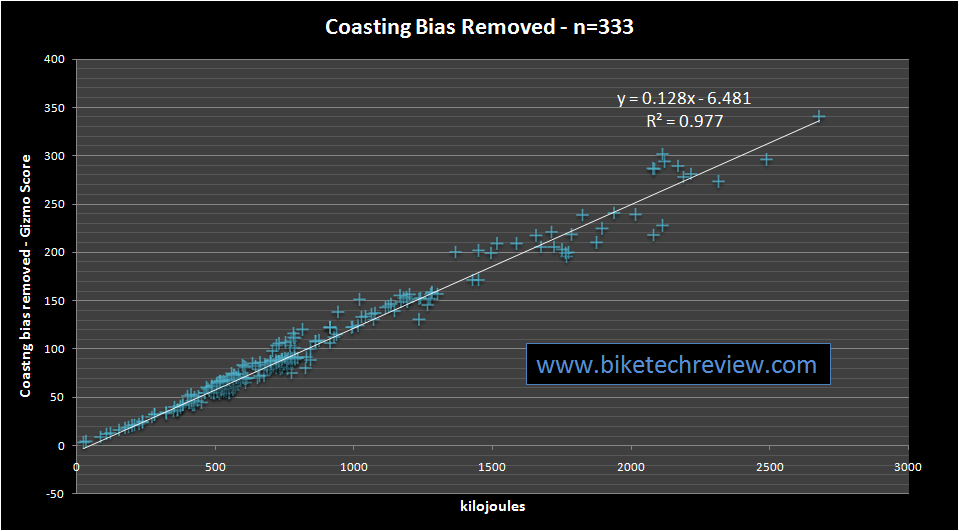
The vertical axis is adjusted gizmo score - basically, it's the gizmo score with the coasting/soft pedaling bias removed.
I removed the rides around where you suggested and came up with a value of .947. Was that more, or less, of a decline than you had hoped for?
Why would you advocate selective removal of data?
"...it's the gizmo score with the coasting/soft pedaling bias removed."
I must be dense, but I'm not following what you mean above. I can decode "gizmo score" ;-) but I'm not sure what exactly "coasting/soft pedaling bias" is and how you remove it.
"Why would you advocate selective removal of data?"
I'm not. It's just a way to see something about the data. Not that I'm a statistical expert or anything, but here's a word I learned today:
http://www.reference.com/search?r=13&q=Heteroskedasticity
I thought it was pretty cool that with:
1)a sweet SRM binary file decoder ring
2)time spent soft pedaling
3)KJ's
4)no assumptions
I was able to account for nearly 98% of the variation. Make of the data what you will.
Keep it fun out there,
kraig
I think it's all pretty cool too.
Oh, and you ARE pretty geeky as well...but I mean that in a *good* way ;-)
From a fellow geek.
If you are referring to TSS, then I did my own plot which didn't show much of a relationship:
http://alex-cycle.blogspot.com/2006/12/tss-vs-kj.html
It depends on how varied your training is. I'm more of a track enduro/crit man.
This post has been removed by the author.
zHi Alex,
I have four questions which are similar to ones which have been elsewhere in the past.
In your plot, have you included the score accumulated while coasting (or soft pedaling)?
Is it possible that any difference is a mathematical artifact?
If the difference is more than just mathematical, has something convinced you that the difference has a genuine meaning which can’t be garnered from a reasonably experienced look at the files? For example, two rides of 1000kj can be much different, but the files tell the story.
How reliable is this potential meaning when comparing different types of rides where a difference exists?
Thanks, Kirk
Post a Comment
Links to this post:
Create a Link
<< Home